
On-off lockdowns throughout the 2020/2021 Premier League season allowed myself, like many others, more time on their hands than usual.
While I tried to use the time productively where possible, this certainly wasn’t in a wholly consistent and logical manner. When the Premier League season kicked off again in September amidst rising coronavirus cases in the UK and a looming lockdown 2, I decided to start tracking certain Fantasy Football numbers on an ever-expanding spreadsheet.
As day turned to night and lockdown 2 soon become lockdown 3 in the New Year, I started doing this in more detail and it became a fun little data inputting task at the beginning of the week when all the FPL numbers were updated.
This was with no real initial reason other than a little sprinkle of self-indulgence coupled with the fact I quite like housing data on spreadsheets and adding to it incrementally over time and then building out simple pivot tables.
But with the football now season over and left with a seemingly pointless spreadsheet full of stats on players I used during my Fantasy Football ventures, I thought I’d share ways in which this could actually be used within an SEO reporting context.
Funnily enough, I actually found myself doing almost exactly this as part of a project I was involved in at the time that had minimal SEO reporting capabilities and saw me manually pulling nuanced data into spreadsheets in a similar manner to present them to stakeholders.
So let’s get stuck in. Firstly, here’s a link to the spreadsheet in question:
https://docs.google.com/spreadsheets/d/1lAhKA4OIfw9Hyh3xfHgTDNJALXwX9-Aimp2HCHL05aw/edit?usp=sharing
You’ll see a spreadsheet telling my FPL journey with the following data:
- Player name
- Team
- Times picked (including as substitute)
- Nationality
- Player cost (at end of season)
- Total points
- Minutes played
- Clean sheets
- Assists
- Goals
- Points I gained from them (not including captaining)
- Points I missed out from them on the bench
- Average points I gained per game
In terms of trends and insights throughout the course of my season, I’ve detailed that an accompanying Twitter thread which you can browse if you’d like to. This details things such as the number of times I picked players and their average points per game, teams picked and points gained, points gained vs points left on the bench and so on.
Although there is probably a way in which these data fields and pivot tables could be used for some SEO reporting purposes in their own right, I suspect they’re largely irrelevant to most readers. With that in mind, I’ve built out some accompanying tabs where I’ve tweaked these FPL columns into something that could actually be useful for the day to day SEO.
Let’s explore the various “SEO Metrics” tabs I’ve set up on the spreadsheet to see how juggling up these sheets could help you in that regard.
One obvious disclaimer is that FPL metrics don’t necessarily translate to useful SEO metrics, as hard as I may want them to. Aside from obvious metric renaming, I’ve removed some of the more superfluous columns from some of the reporting tabs. Dummy stats have also been populated into these tabs for the purposes of this post with the use of dummy formulas, so please remove them for your own reports. And yes, I’m aware this is highly tenuous at best.
Tab 1: Crawling/Keywords/Traffic
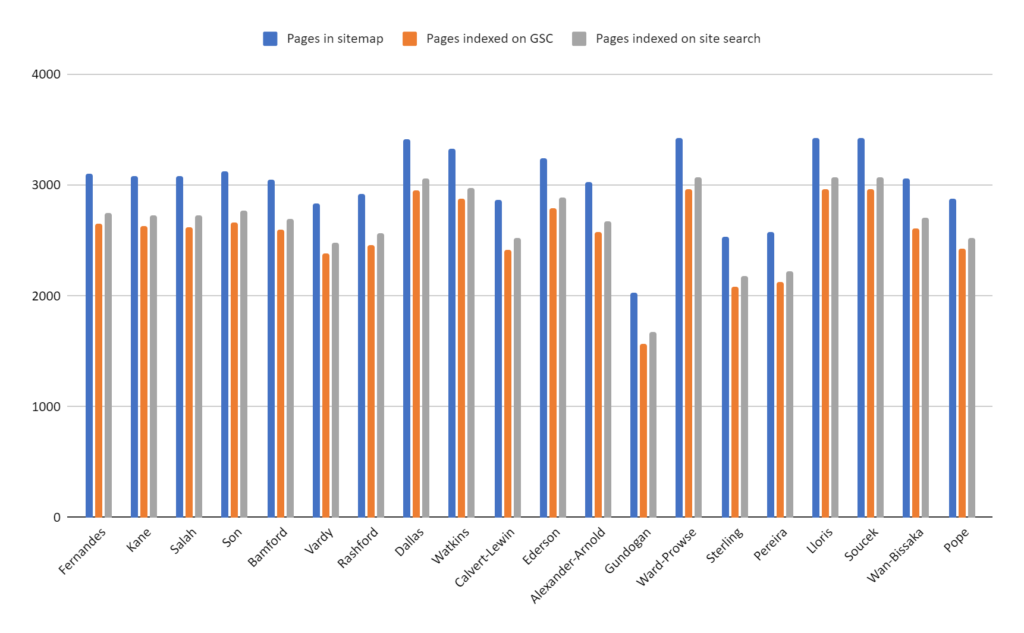
Want to compare and contrast some crawling stats from different resources and see how your sites are performing? I’ve created tabs columns here for your URLs or websites, pages listed in your sitemap, pages indexed on Google Search Console, pages indexed on site search, crawled not indexed, excluded from index and indexed not in sitemap.
I’ve added traffic and keywords ranked columns alongside side, with the aim of understanding if there are any indexation quick wins/problems that can be mined from your best or worst performing pages.
The crawling and indexation metrics are readily available via GSC and Screaming Frog exports, though you can fill these in (alongside traffic and keyword data) from wherever you please.
Here’s what using this report could bring you in terms of priceless data (I haven’t changed the player names to URL/website as denoted in the report for the LOLs):
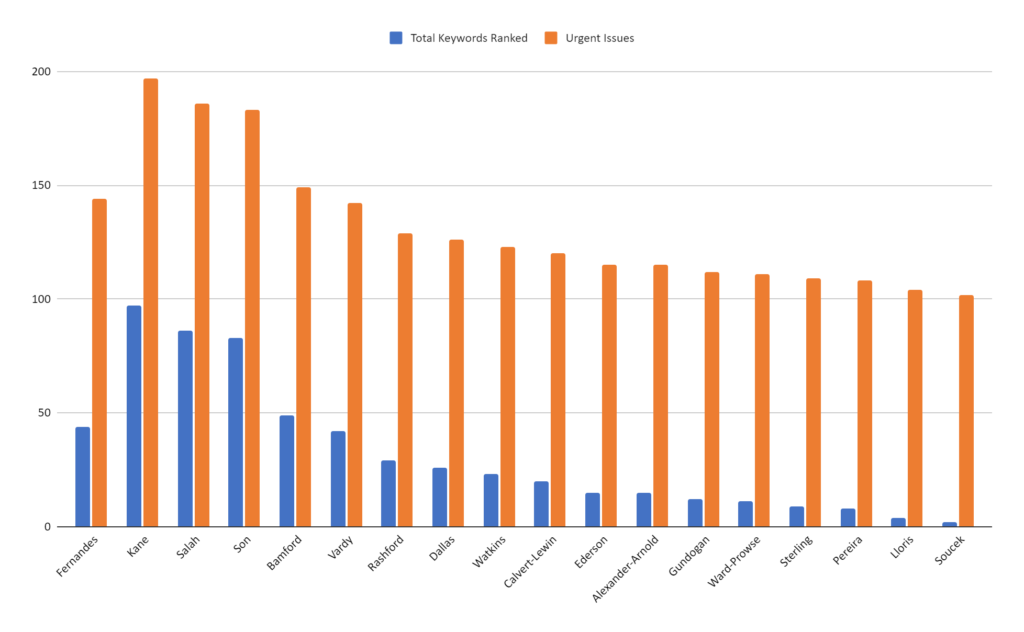
Tab 2: Technical Issues/Traffic/Keywords
This tab looks at some straightforward metrics in relation to technical SEO issues on each URL and their respective category. This can possibly help you identify issues by landing pages alongside traffic and conversion stats with a view to prioritisation.
I’ve bucketed these technical SEO issues into “Medium” and “High” though this can be renamed to “Error” or “Warning” depending on what tool you’re importing your exported errors from (say Ahrefs). Feel free to of course split out these error columns by individual errors or name then as you please.
Here, in one simple slicing and dicing of the data, we can see Tomas Soucek is having a bit of a nightmare.
However, when looking at conversions Soucek is up there with the best. If you’re in the familiar position of being Harry Kane or Mohamed Salah, enjoying good organic visibility but struggling with conversion optimisation, then it’s best to blame the product team.
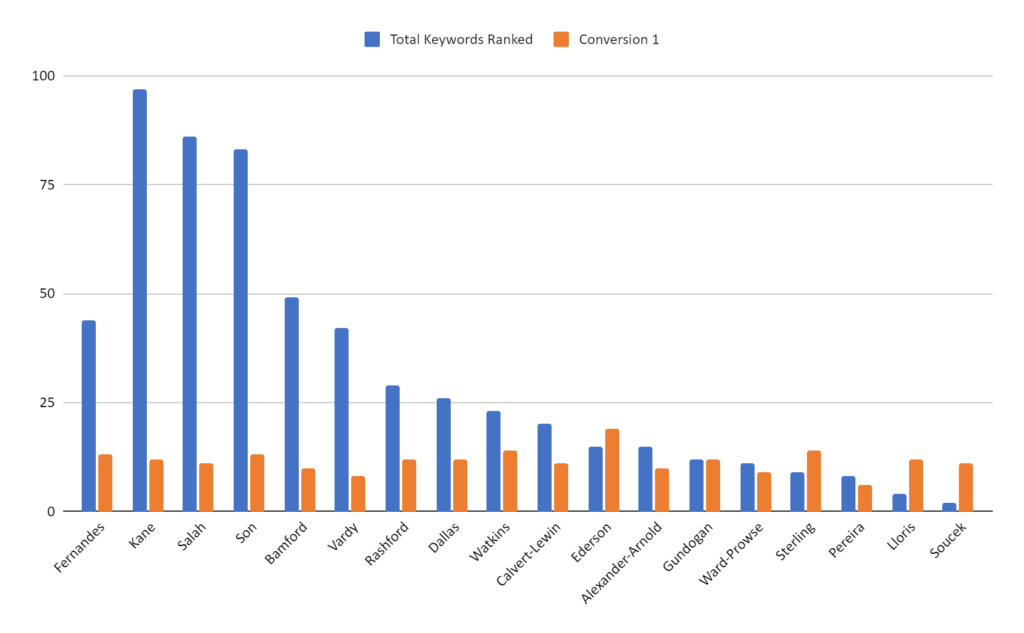
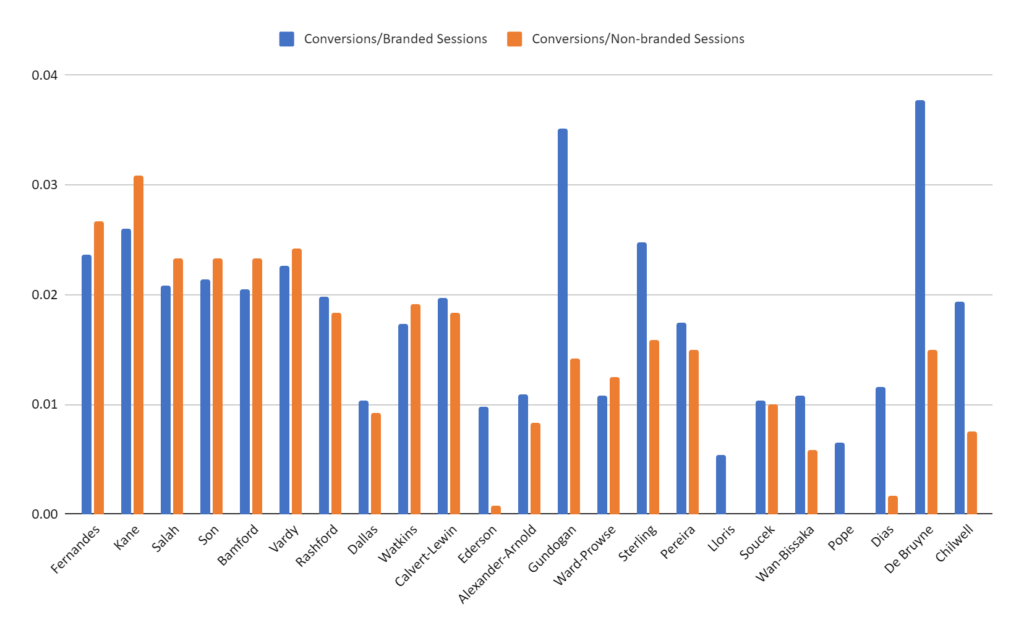
Tab 3: Traffic/Keywords/Conversions
This one looks at a wide range of data splitting out traffic, keywords ranked and their averages, GA conversions and how this is performing across branded and non-branded funnels.
Export and input the data as you please. If we’re exporting from third-party keyword ranking tools then go to town on your keyword bucket categorisation for deeper insights.
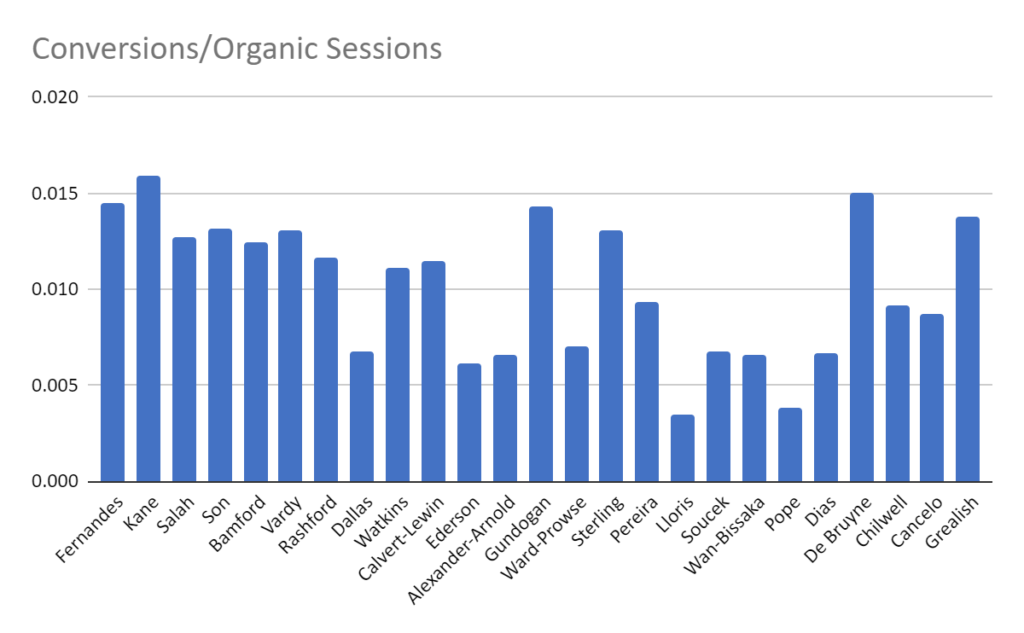
Tab 4: Keywords & Forecasting
The final template tab I made was looking at what traffic and conversions individual keywords bring. This can be exported and uploaded from a number of tools including Google Search Console.
I’ve also added a couple of columns for your own forecasting purposes, though do feel free to expand on this. This can be inputting something like”if keyword in column A move up rankings by 5 over X period of time we may see X traffic and X conversions”. A fun old exercise we all have to do from time to time though I’ve left this blank as each forecasting scenario will of course be unique.
On to the Euros then…
If I have time I’ll do this again for the 2021/2022 season (the FPL stats that is). If you find this useful, any feedback additional stats or anything else you’d like to see would be more than welcome.
While this is intended as a bit of fun, it was partly born out of frustrations with third-party SEO tools and having to almost always export their data into Excel and manipulate to serve my needs. A familiar exercise for us all I’m sure.
My recommendation would be to add your own further metrics (average order value, average time spent on page etc) and play around with some pivot charts.